Energy Strategies
Discover some of the least expensive ways to decarbonize electricity.
Who it helps
Carbon accounting experts
Researchers
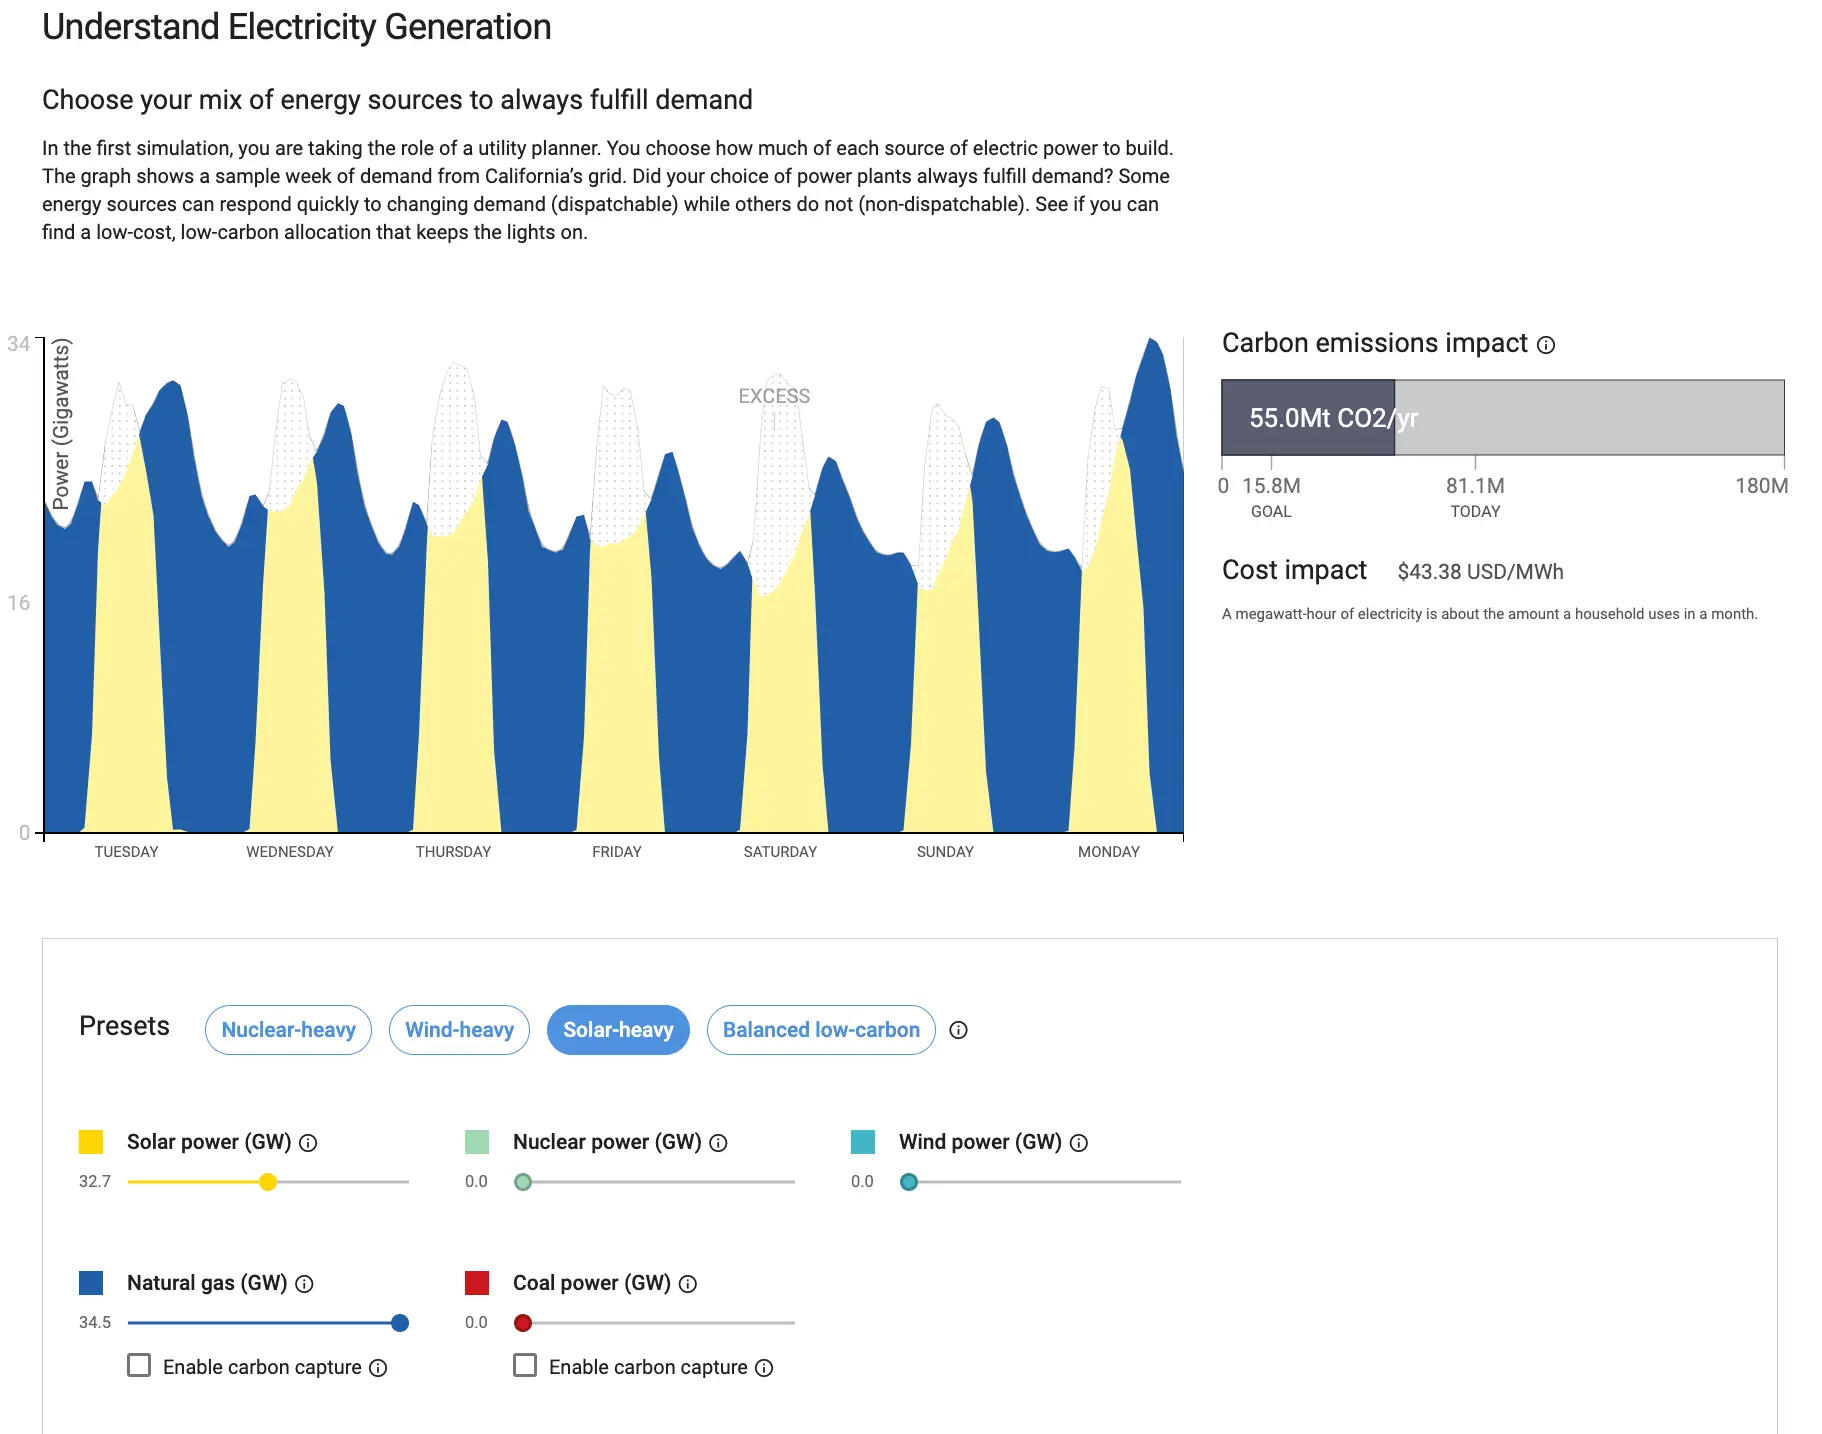
What it does
Shows how different assumptions about the future of technology and policies affect the future cost to generate electricity and the amount of carbon dioxide emitted
In collaboration with
Climate and Energy team in Google Research


How it’s used
Exploring strategies to decarbonize electricity