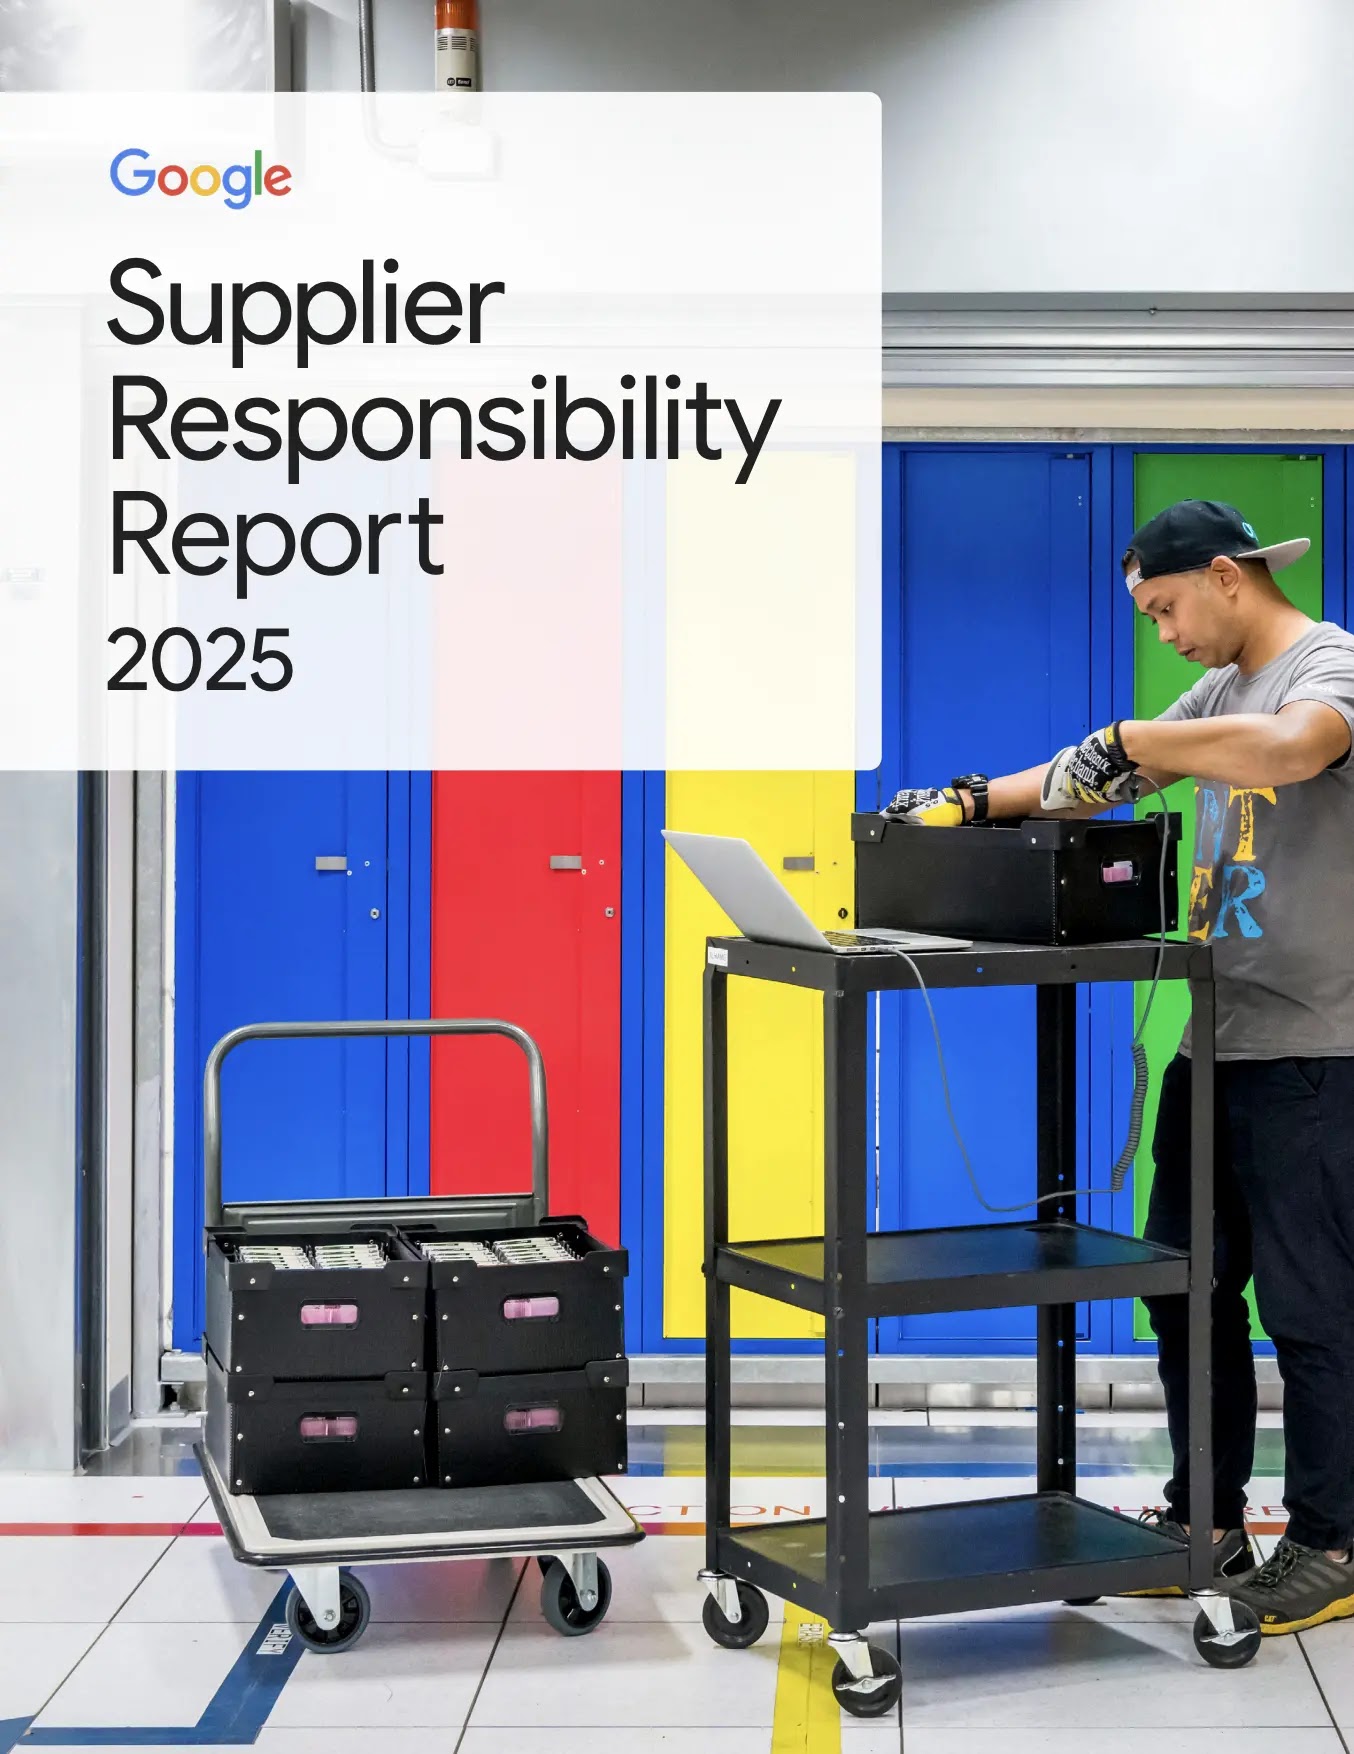
Water stewardship
Aiming to replenish more water than we consume and help improve water quality and ecosystem health in the communities where we operate
At Google, we utilize water to help cool our data centers and in our offices around the world. Water is also used throughout our value chain, in the manufacturing of both consumer hardware products and data center equipment.
We work to drive water efficiency and reuse across our global operations. From reducing our potable water use intensity at our San Francisco Bay Area headquarters to exploring ways to incorporate circularity strategies, we've worked to drive water efficiency and reuse across our global operations.
Our water stewardship strategy is centered around assessing and addressing water-related risks to our business and the opportunities we have to not just mitigate those risks, but also create solutions that can be scaled beyond our own corporate footprint and to partner with others to address this shared challenge. We aim to replenish 120% of the freshwater volume we consume, on average, across our offices and data centers, and help restore and improve the quality of water and health of ecosystems in the communities where we operate.
When it comes to addressing shared water challenges, technology can be a useful tool to bring visibility to these challenges to enable smarter, more informed decision-making. We’re building tools to make water data and technology universally accessible, enabling effective water stewardship and improving the resilience of watersheds and ecosystems.
Our key efforts
Data centers

These colorful pipes in our Douglas County, Georgia data center send and receive water for cooling our facility
To minimize the net-climate impact at each of our data center campuses, both today and in the future, we consult with local experts and make regionally appropriate cooling technology decisions that balance the availability of carbon-free energy and responsibly sourced water.
In many places, water is the most efficient means of cooling. When used responsibly, water cooling can play an important role in reducing emissions. We’ve found that our water-cooled data centers use about 10% less energy and emit roughly 10% less carbon emissions than our air-cooled data centers.1
In 2022, we described our climate-conscious data center cooling strategy, in which we both champion responsible water use and pursue our target to operate on 24/7 carbon-free energy by 2030.
At our data centers, we aim to implement technologies and solutions that reduce freshwater consumption when feasible, and utilize alternative sources such as reclaimed wastewater and even seawater. We use reclaimed or non-potable water at 25% of our data center campuses. Due to these systems, 23% of our total data center water use (excluding seawater) is reclaimed wastewater and other non-potable water.
For example, at our data center in Douglas County, Georgia, we redirect local sewer water that would otherwise be discharged in the Chattahoochee River and use it to cool our facility. Additionally, at our data center in Eemshaven, the Netherlands, we partnered with the community to bring in industrial canal water to cool our data center, leaving potable water for other uses.
Related resources
Offices

Our Bay View campus at night. Photo by Iwan Baanis
Around the world, our offices use water for a variety of needs from preparing food for workers and sanitation, to irrigating campus landscapes, and keeping our workspaces cool. We take a variety of approaches to manage water responsibly and drive responsible water use in our real estate operations through increased efficiency and by sourcing water from non-potable supplies.
One of the main ways we conserve water in Google workplaces is by adopting design standards aligned with leading third-party certifications, including Leadership in Energy and Environmental Design (LEED) and the Living Building Challenge (LBC). Our building design requirements for new construction include incorporating water-efficient fixtures, such as faucets, toilets, and irrigation systems. These design standards also address replacing old fixtures with highly efficient ones in any space we move into, and installing water meters with automatic leak detection.
Beyond these standards, we drive water stewardship in our workplaces by developing innovative solutions that strive to be replicable and scalable. For example, our new Bay View campus, which opened in 2022, is on track to be the largest development project in the world to achieve Water Petal certification from the LBC, aiming to produce more non-potable water than there is demand for at the site.
Additionally, we advance water stewardship on our campuses by designing landscapes with native plants and drought-tolerant species. We’re also using non-freshwater supplies where it's available and extending municipal reclaimed source water lines to serve more of our facilities.
Related resources
Did you know?
-
Predictive models estimate that Bay View's geothermal energy system eliminates about 90% of the water needed for cooling, and the campus treats stormwater and wastewater for reuse in toilet flushing and irrigation.
-
“Water positive” at Bay View means we will produce more non-potable water than we have demand for at the Bay View site.
Supply chain

Tightening a valve coupling in our Hamina, Finland data center to ensure we keep seawater from the Gulf of Finland in the appropriate cooling pipes
Addressing water challenges requires accurate water use data throughout our supply chain. By monitoring this data, we can focus our water stewardship efforts on supplier facilities with the greatest opportunities for improved management. To measure water use and assess water risk in our value chain, we ask suppliers to disclose water-related data via the CDP supply chain platform and complete and disclose water risk assessments of their direct operations and value chain.
In 2022, 177 of the 186 suppliers (95%) that were invited to participate in the Water Security portion of the CDP Supply Chain survey responded. This reporting includes data on water withdrawal, consumption, and discharge—all water withdrawn from all sources, the portion of water permanently lost in the withdrawal, and the water effluents discharged to all locations.
The combined dataset we received from this outreach provides crucial insights into our supply chain’s water footprint that can inform our supply chain risk-management strategies.
Related resources
Our goal to replenish more water than we consume

Cooling towers at our data center in St. Ghislain, Belgium
In 2021, we announced our goal to replenish more water than we consume by 2030. We aim to replenish 120% of the freshwater1 volume we consume, on average, across our offices and data centers, and help restore and improve the quality of water and health of ecosystems in the communities where we operate.
This ambition is bold, particularly when considering both the growth of our business and the challenges and complexities of global water stewardship work—understanding the most impactful intervention requires local context related to shared water challenges, and water replenishment is still a maturing community with some limitations to identifying ready-to-implement project opportunities.
We aim to achieve this replenishment target through continued and scaled investments in projects that are located within the watersheds we rely on to provide water to our data centers and offices. We work with external partners to implement these projects, which deliver both volumetric water benefits and improve other locally relevant aspects of watershed health, such as water quality, community water access, and biodiversity.
While we still have a long way to go to meet our 2030 target, we’re proud of our progress this year—replenishing 6% of our 2022 freshwater consumption.
Tracking our progress
Target
Replenish 120% of the freshwater volume we consume, on average, across our offices and data centers by 2030.
Target year
2030
Status
2022
As of the end of 2022, our contracted watershed projects have replenished 271 million gallons2 of water, or 6% of our 2022 freshwater3 consumption.
Related resources
Did you know?
-
As of the end of 2022, we estimate our 38 replenishment projects had the capacity to replenish over 1.3 billion gallons of water annually once fully implemented.2
-
As of the end of 2022, we've supported 38 water stewardship projects in 26 watersheds. In 2022 alone, we added 25 projects to our portfolio in places including Chile, England, India, and the United States.
Quantifying and visualizing surface water changes

Led by our Google Earth Outreach team, we’re supporting efforts to scale models and solutions that make water resource information visible and actionable. At the individual level, Google is working to provide people around the world with information and tools to manage water resources effectively and enhance water-related disaster preparedness.
Following the launch of the Sustainable Development Goals (SDGs), the United Nations Environment Programme (UNEP) requested that all 193 member states provide indicator 6.6.1 data on their water ecosystems. At that time, the majority of member states could not report on this metric. To fill this gap, UNEP and the European Commission’s Joint Research Centre (JRC) partnered with Google to develop the Freshwater Ecosystems Explorer to quantify and visualize surface water changes over the course of decades. This free, easy-to-use geospatial platform and data product helps decision-makers access national, sub-national, and basin-level data on freshwater ecosystems
Together with academic and government research groups, Google also co-developed OpenET to help improve water management by supporting the development of evapotranspiration (ET) models. These models provide estimates of how much water is transferred from the land to the atmosphere, a crucial but difficult to measure process within the overall hydrological cycle. OpenET is making satellite-based ET data widely accessible to farmers, landowners, and water managers.
Timelapse in Google Earth is a global, zoomable time-lapse video of the planet, providing evidence of earth’s dynamic changes since 1984—from irrigation systems emerging in the deserts of Egypt to meandering rivers shifting over time in the Amazon rainforest in Pucallpa, Peru.
Related resources
Did you know?
-
Timelapse in Google Earth is now updated with new imagery from 2021 and 2022. You can also view a library of over 800 Timelapse videos for more than 300 locations at g.co/TimelapseVideos.
-
By 2025, two-thirds of the world’s population could live in water-stressed conditions, and with the existing climate change scenario, almost half the world’s population will be living in areas of high water stress by 2030.
Predicting and preventing water stress

Image provided by CNES / Airbus, Maxar Technologies
The Google Flood Forecasting Initiative, launched in 2018, uses AI to predict when and where riverine flooding will occur—to help keep people safe and informed. These breakthroughs are a result of innovative modeling approaches that utilize machine learning to create scalable models in real-world settings.
In addition to flood alerts in certain countries, our Flood Hub platform displays the flood forecasts to help governments, aid organizations and communities at risk take timely action.
We apply advanced machine learning methods on a broad range of publicly available data sets, such as satellite imagery, river data and weather data. These data sets help to generate high quality flood forecasts with two models, a hydrologic model and inundation model, that can predict when rivers will overflow and the exact locations where riverine flooding will take place, up to seven days in advance. These actionable early warning systems help to save both lives and livelihoods.
In May 2023, we expanded coverage to territories in 60 new countries across Africa, the Asia-Pacific region, Europe, and South and Central America. Flood Hub now displays forecasts for 80 countries. This includes some of the territories with the highest percentages of population exposed to flood risk and experiencing more extreme weather, covering 460 million people globally. All forecasts are displayed for free.
Related resources
Did you know?
-
Annually, floods cause tens of thousands of fatalities worldwide, disrupt the lives of millions and cause financial damages in the billions.
Grants to promising water stewardship solutions

Outside of our Eemshaven, Netherlands data center
In addition to the work that our Google Earth Outreach team is spearheading, Google.org has also awarded millions of dollars in grants to promising water stewardship solutions, including:
- BlueConduit, to develop publicly accessible tools to quantify and map hazardous lead service lines for vulnerable communities, a critical first step to replacing unsafe water infrastructure.
- Global Water Watch, which aims to democratize information on water resources. This information will empower policymakers, conservation organizations, and communities to better manage water resources collectively.
- American University of Beirut, to apply machine learning to weather and agricultural data to improve irrigation for resource-strapped farmers in Africa and the Middle East, providing farmers with near-real time water-use data predictions to conserve the region’s dwindling water resources.
Related resources
Report
Google Water Stewardship: Accelerating positive change at Google, and beyond
This paper describes our water stewardship work to date and our ambitions for the future—both at Google and beyond. We’re focusing on three areas: enhancing our stewardship of water resources across Google office campuses and data centers; replenishing our water use and improving watershed health and ecosystems in water-stressed communities; and sharing technology and tools that help everyone predict, prevent and recover from water stress.
September 2021