Reaching our solar potential, one rooftop at a time
Featured technology
Project Sunroof
Google Earth
Machine learning
Who we’re helping
Homeowners
Families
Individuals
Our role
Built a tool to help drive consumer awareness and education and make it easy for interested homeowners to connect with solar providers in their area

The sun produces an astonishing amount of energy. In one second it generates enough to meet the needs of civilization for 500,000 years. More important, enough sunshine hits the earth in a single hour to power the global economy for a full year. Unfortunately, only a tiny fraction of that energy is captured. If all the suitable rooftops in the U.S. had solar panels, they could supply 39% of the nation’s energy needs. In short, humanity is sitting on — or rather, under — some massive potential with solar energy.
Why is solar still so undervalued? It’s partly an infrastructure problem; the traditional power grid isn’t ideally suited to renewable power sources. It’s a marketing problem as well: Way too many people still think of solar for their home as an expensive luxury when in fact solar production costs are at an all-time low, and behind-the-meter solar is now often cheaper than grid power.
But ultimately it’s an information problem. For most people, the road to solar power is paved with questions: about affordability, weather and light patterns, usable roof area, angle and tilt, government incentives. The information is scattered across the web, from databases by the U.S. Department of Energy1 to solar suppliers’ websites. Going solar, in other words, isn’t anywhere near as easy as it should be, and could be.
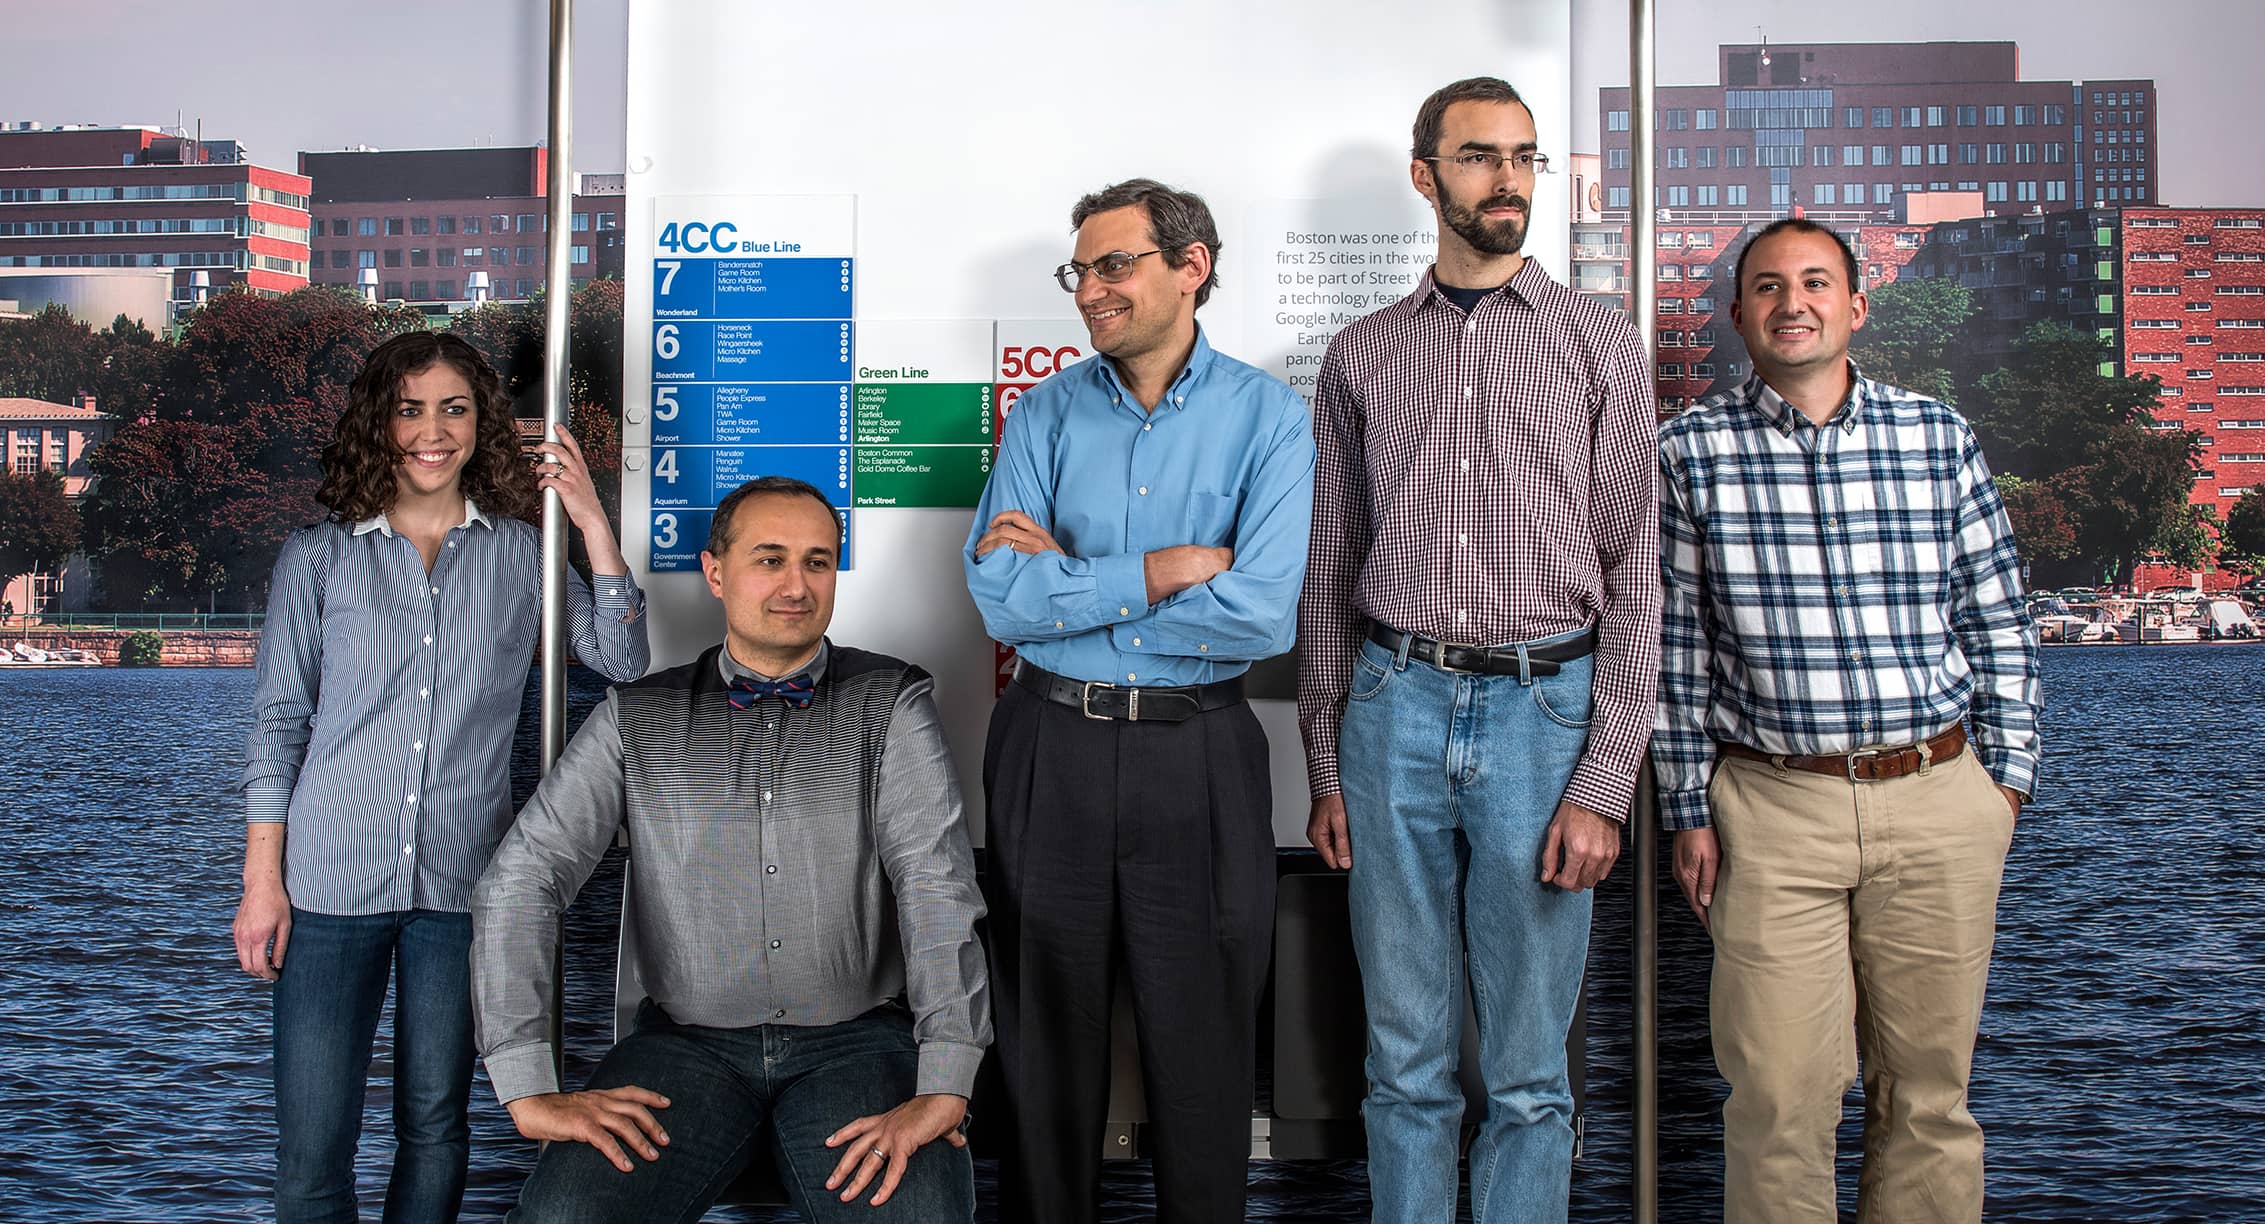
But several years ago Carl Elkin, an engineer in Google’s Cambridge, MA, office, had a realization: If you pulled together a bunch of different data streams and did a bit of tricky math, you could produce, for any given address, a solid estimate of how much solar energy that rooftop could provide.
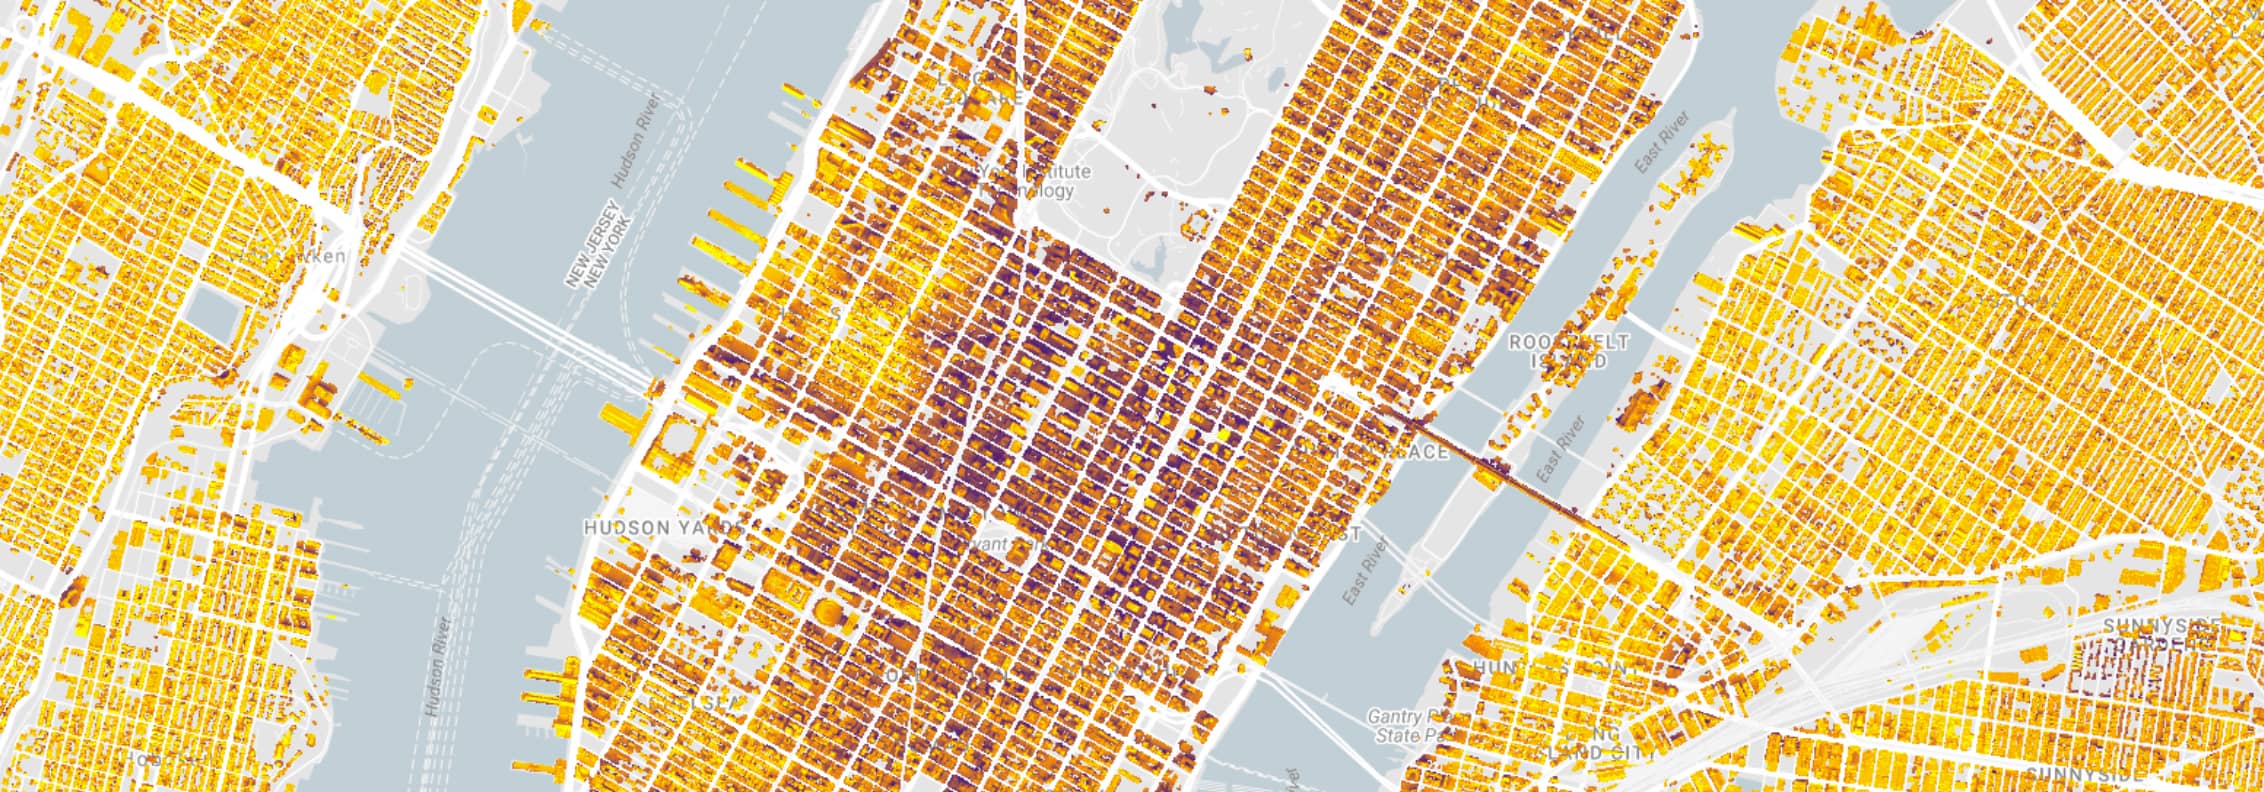
The idea started with the rooftop satellite imagery displayed in Google Earth: Those shots provide a digital surface model showing the direction a roof faces (south or southwest exposure is best), the angle of its tilt, and the presence of shady objects like trees. From there you can model how much sunlight hits a rooftop surface by tracking the light through the day, using 3-D geometry. Add in data about weather patterns, calculate the averages over the course of a year, convert from sunlight to kilowatt-hours, and boom: a baseline estimate of that roof’s solar potential. From there, it’s just a few extra calculations to provide a cost estimate customized to that address.
Elkin shared the idea with colleagues. Dozens of people in five offices volunteered to pursue it. “People started coming out of the woodwork,” Elkin says. As the project team evolved the tool, other ideas were added. Sunroof averages 20 different energy usage scenarios, and people can input their exact costs and usage to make it even more accurate.2 The team also employed machine learning to help Sunroof do things like better distinguish roofs from trees and measure light from every area of the sky.
Enough sunshine hits the earth in a single hour to power the global economy for a full year. Unfortunately, only a tiny fraction of that energy is captured.
Sunroof processes roughly 1 petabyte (1,000 terabytes) of data: height and color for 43 million homes; weather information; about 1,000 state and local incentives; and hundreds of local electricity rates.
Over the past 3 years, Sunroof has grown from a part-time project to a full-time job for Elkin and his team. Initially launched to drive consumer awareness and education, the service now also makes it easy for interested homeowners to connect with solar providers in their area. Sunroof covers 43 million rooftops in the U.S. — which is more than 50% of all households — and in the coming months will be available in all 50 states.
The team is also exploring international expansion and recently launched Data Explorer, a tool that gives researchers, community advocates and local policy makers access to more aggregated data of solar potential to help them make the case for larger solar deployments at the state, county, city, and neighborhood levels.
One of the industry’s biggest financial impediments has actually been customer acquisition cost; competition is so tight that providers spend almost 44% of the cost of an installation just to win new contracts.3 To offset this problem, Sunroof gives referrals to solar providers for free.4 We can’t think of a better way to help let the sun shine in.
2 Currently available in 42 states.
3 https://www.nrel.gov/docs/fy15osti/64746.pdf
4 Sunroof offers only contact information that the person explicitly requests to share with a solar provider.
Further Reading
-
August, 2015
Project Sunroof: mapping the planet’s solar energy potential, one rooftop at a time
Learn moreProject Sunroof is a new online tool we’re testing to help homeowners explore whether they should go solar.
-
Project Sunroof methodology and inputs
Learn moreProject Sunroof puts Google’s expansive data in mapping and computing resources to use for people and organizations interested in solar power, helping illustrate the potential of solar power for a single house, and with the introduction of the data explorer, the potential of solar for zip codes, cities, counties and states.
-
Project Sunroof website
Learn moreSee what’s possible with solar in your community.